Turn claims chaos into risk intelligence

Claims Discover ingests your full claims folder (reports, bordereaux, photos, notes) and extracts structured insights on root causes, loss drivers and emerging patterns that traditional systems miss.

Man and woman working on laptops side by side at a shared desk in an office.
Challenge

Claims data shows what happened but rarely explains why

Icon arrow pink

Root causes stay buried in expert reports, adjuster notes, legal correspondence and surveys. Without structured extraction, organisations can't systematically identify:

Icon arrow pink

Loss drivers and causal chains behind severity

Icon arrow pink

Wording intent vs. actual claim outcomes: disputes, exclusions, grey zones

Icon arrow pink

Silent drift in underwriting assumptions

Claims don’t fail in isolation. Risk emerges at portfolio level

Icon arrow pink

Every claim carries signals about the wider portfolio. But traditional systems don't connect claim-level attributes to book-wide patterns:

Icon arrow pink

No automatic linking between claim factors and portfolio accumulation

Icon arrow pink

Underwriters forced to zoom in and out manually to build context

Icon arrow pink

Claims remain a cost when they should be your source of risk intelligence

Solution

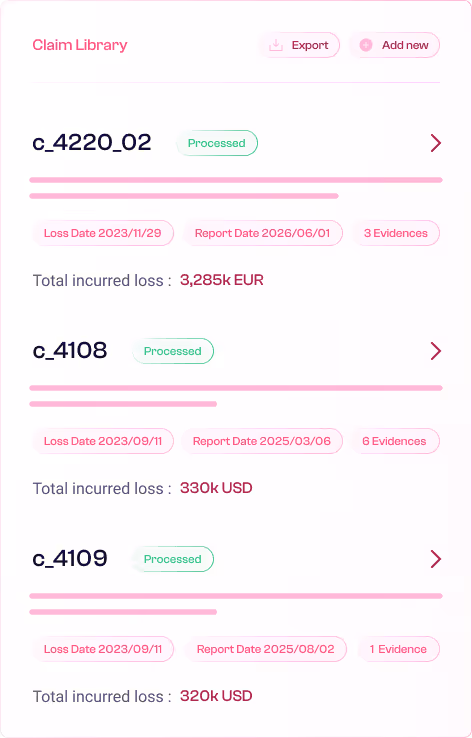
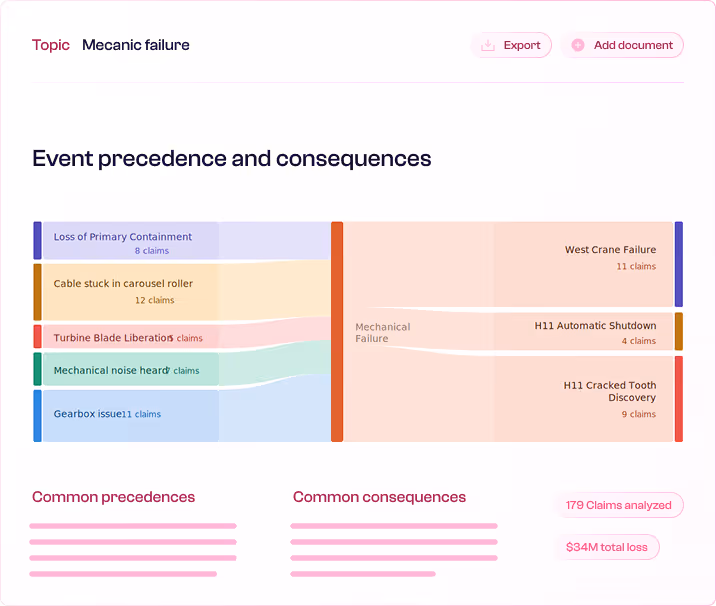
From fragmented files to a single actionable risk picture

Claims Discover extracts, structures and centralises causal evidence from the claims record.

Every team works from the same standardised risk picture to identify patterns, challenge assumptions and trigger better decisions.

Icon target

Underwriting

Feed claims-derived signals back into risk selection, pricing adequacy and referral triggers. Detect silent drift in assumptions before it reaches the loss ratio.

Icon eye

Portfolio management

Map severity drivers, peril combinations and accumulation patterns across the book. Move from reactive reserving to forward-looking exposure insight.

Icon pen

Policy wording

Surface ambiguity hotspots, coverage gaps and misalignment between wording intent and actual claim outcomes. Prioritise clause remediation where disputes and leakage concentrate.

Curved thin blue lines forming a wave pattern on a black background.Thin, curved, parallel lines flowing horizontally from left to right against a black background.
How it works

End-to-end, from ingestion to decision

Claims Discover processes your full claims record end-to-end, so teams can focus on what matters: root causes, loss drivers and emerging patterns across the book.

Step 1

Ingest & manage the full claims record

Claims folders flow in from any source: reports, adjuster notes, legal correspondence, photos and surveys. Documents are classified by type, linked to the correct claim and processed at scale, whatever the format, language or level of messiness. Every file is versioned, traceable and ready for analysis.

Claim Library screen showing three processed claims with IDs c_4220_02, c_4108, and c_4109, their loss and report dates, evidence counts, and total incurred losses in EUR and USD.Diagram showing the word 'Case' at the center with arrows pointing inward from terms: '1 day', 'commercial lines', 'specialty', 'treaty', 'facultative', and 'delegated authority' on a light blue background.Pink slanted triangle shape on the right edge over a black background.
Step 2

Generate the causal graph

For each claim, Claims Discover identifies root causes and contributing factors, ranks them by role and confidence, and maps the full chain of events. Causation, liability, quantum and coverage positions are grounded in source documents across the entire dossier, so every finding is traceable, not inferred.

Chain of events diagram showing primary cause on 12/11/2024 as installation of out-of-specification pipe causing technician dispatched on 25/12/2024.Pink and black abstract geometric shape with diagonal division.
Step 3

Aggregate and standardise across the book

Loss drivers are normalised against your underwriting and exposure taxonomies and aggregated across the portfolio into ranked topics. Each topic surfaces root cause analysis, event precedence, severity data and escalation signals, consistently at every re-run.

Chart listing top three insurance claim topics: #1 Mechanical Failure with 43 claims and $456.52M incurred representing 36% of total claims marked as increasing; #2 Manual handling with 39 claims and $352.33M incurred representing 30% of total claims; #3 Hazardous chemicals with 29 claims and $32M incurred representing 12% of total claims.
Step 4

Detect patterns and trigger decisions

Recurring causal sequences are detected as patterns, ranked by frequency and financial impact, and tracked as they intensify over time. Each pattern produces structured recommendations split by team: pricing signals and referral triggers for underwriters, clause remediation priorities for wording, accumulation and exposure actions for portfolio management.

Diagram showing event precedence and consequences of mechanical failure with claims counts for loss of primary containment, cable stuck in carousel roller, turbine blade liberation, mechanical noise heard, and gearbox issue leading to mechanical failure, which results in west crane failure, H11 automatic shutdown, and H11 cracked tooth discovery.
Series of smooth, white, curved lines forming a wave-like pattern on a black background.
Key capabilities

Extract causes. Detect patterns. Trigger decisions.

Claims Discover structures all claims information and delivers it as decision-ready signals. For every team, at every level of the portfolio.

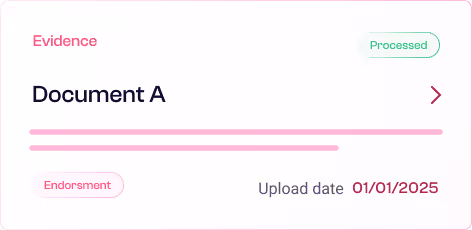
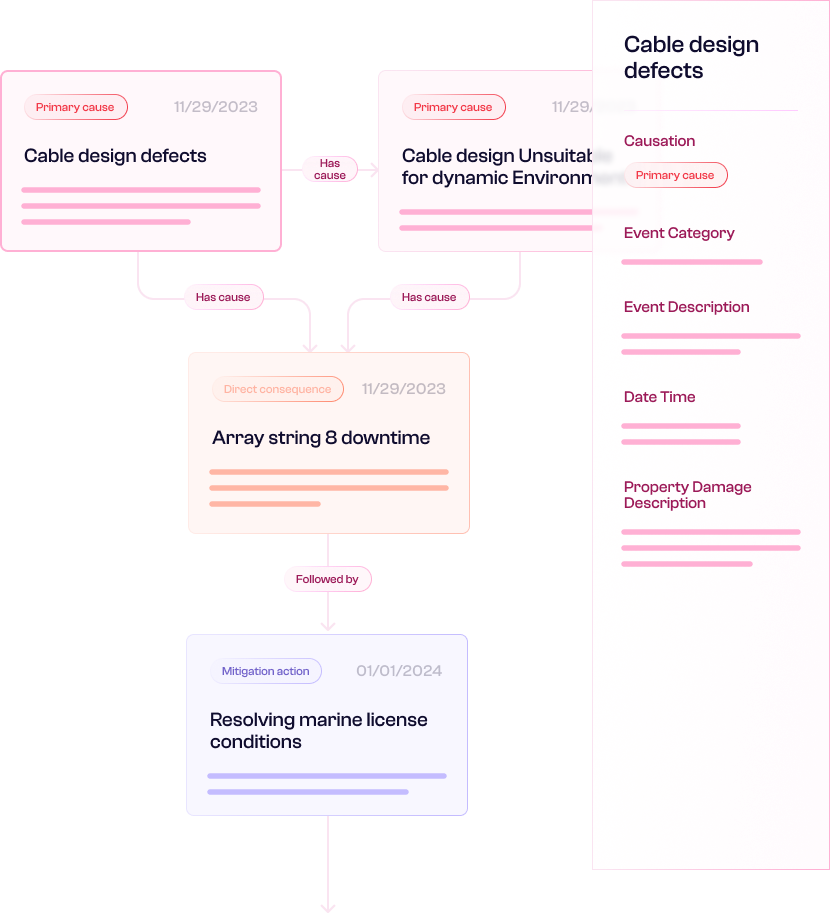
Knowledge extraction & causal grounding 

Structure causation, liability, quantum and coverage data from the full claims file. Every insight traces to source evidence with hallucination reduced by design.

Referential normalisation & taxonomy management 

Auto-build and govern normalised reference lists and risk classification frameworks. Aligned to your underwriting and exposure taxonomies.

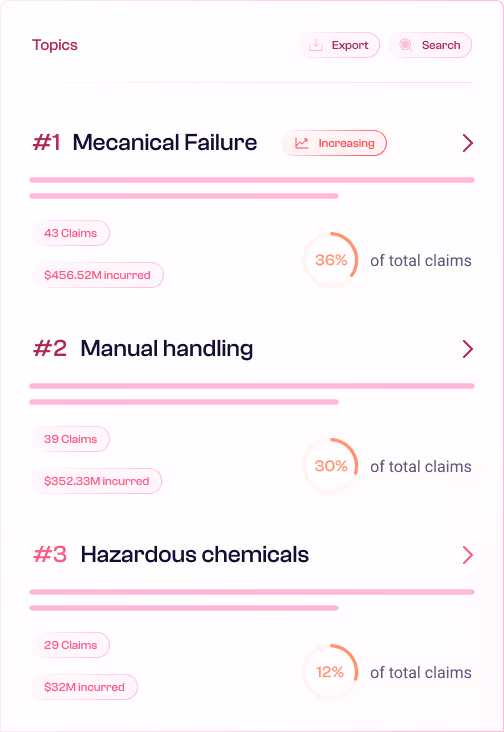
Pattern detection & severity analytics 

Surface emerging loss patterns, contributing factor combinations and accumulation signals across lines, segments or programmes.

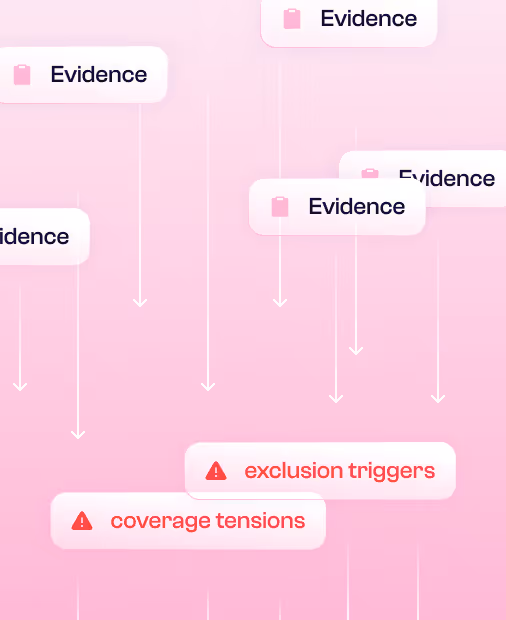
Flexible aggregation & wording observations 

Slice by client, asset, location, peril or custom dimension. Flag coverage tensions and exclusion triggers with evidence, not anecdote.

Recommendations & risk learning loop 

Generate decision-ready outputs: pricing signals, referral triggers, wording remediation, risk actions. Claims intelligence feeds back into the book continuously.

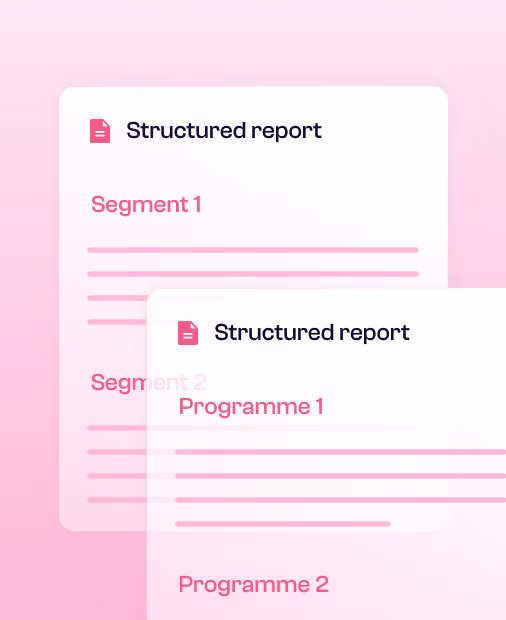
Portfolio reporting & client insights 

Structured loss pattern reports by segment or programme. Share findings with insurance clients to support risk dialogue and retention.

Results

Proven impact across many portfolios

When claims intelligence meets exposure data, underwriting and claims teams don't just understand the past, they reshape the book. Combined with exposure and premium data, these insights translate directly into tighter risk selection, more accurate pricing, targeted wording remediation and sharper reinsurance purchasing.

95% time saved

on manual claims coding and classification

Abstract curved shapes with a smooth gradient from white to light blue on a transparent background.

120+ insight attributes

captured per claim on average, beyond what any traditional system codes

Abstract curved shapes with a smooth gradient from white to light blue on a transparent background.

1,500 claims folders

ingested and structured in a single day

Abstract curved shapes with a smooth gradient from white to light blue on a transparent background.

20 emerging patterns

identified per portfolio on average

Abstract curved shapes with a smooth gradient from white to light blue on a transparent background.

4 risk intelligence recommendations

generated per emerging pattern on average

Abstract curved shapes with a smooth gradient from white to light blue on a transparent background.

4× improvement

in claims data precision and consistency

Abstract curved shapes with a smooth gradient from white to light blue on a transparent background.

20+ lines of business

analysed to date: casualty, property, specialty, life & health

Abstract curved shapes with a smooth gradient from white to light blue on a transparent background.

Global reach

claims portfolios analysed across jurisdictions and regulatory environments

Abstract curved shapes with a smooth gradient from white to light blue on a transparent background.
Differentiators

Why claims and portfolio teams choose Claims Discover

Icon arrow pink
Traditional tools
Generic LLM
Claims Discover

Causal grounding

Manual coding, no causation chain

Probabilistic output, hallucination risk

DAG-based causal structure with confidence scoring

Cross-document extraction

Single document at a time

Limited context window

Stack across reports, notes, surveys, through time

Re-run & consistency

Full rework on change

Unpredictable variance

Re-run engine, revise criteria, maintain consistency

Multi-LOB workspaces

Rigid per-line config

No domain structure

Dedicated workspaces per line, programme or client

Knowledge graph backbone

Flat relational tables

No persistent structure

Graph database, agent-ready, cross-portfolio queries

Adaptability

Static reports

v-pink

One-shot answers

Revise scope, escalation summaries, evolving taxonomies

Insurance-grade AI

Rule-based only

General-purpose model

Built for contracts, regulation and underwriting workflows

Expert templates

Build from scratch

Prompt engineering

Ready-to-use insurance configurations

Enterprise governance

Varies

Limited controls

Multi-region. GDPR, US standards,

Impact

How insurers put Claims Discover to work

Understand what drives severity

Identify root causes, factor combinations and tail drivers across the book

Diagram showing arrows from multiple 'Factor' labels pointing toward a central 'Root cause' label on a pink gradient background.

Detect emerging risks earlier

Surface patterns before they hit the loss ratio

Radar screen with concentric circles and a red warning icon labeled 'Risks' and the word 'Detected' at the center.

Refine underwriting guidelines

Feed claims evidence into appetite, pricing and referral decisions

Graphic of a white box labeled 'Claim evidence' with pink lines representing text and seven white arrows pointing downward from it on a pink gradient background.

Align claims with portfolio strategy

Connect file-level findings to exposure and accumulation views

Diagram with 'Connected' at center linking 'Accumulation views' above and 'File-level findings' below on a pink gradient background.

Improve client conversations

Share structured loss insights that strengthen risk dialogue, retention and engineering recommendations

Two overlapping pink gradient cards with the title 'Message' and bar chart graphics below the text lines.

Summarise claims instantly

Visual and narrative claim summaries for fast triage, escalation and committee reporting

Interface showing sections labeled Priority with Claim 01 and Claim 32, and Other claims with Claim 13 and Claim 63, each accompanied by a pink warning icon.
Pink arrow pointing left.
Pink arrow pointing right inside a light purple circular outline.
Integration

Connects to your world. Doesn't replace it.

Claims Discover is not another claims system. It sits alongside your existing tools and makes them smarter.

Icon gitfork

API-first architecture

Ingest from any source, push insights to any downstream system.

Icon sandy

Live in days, not weeks

Workspace configuration, taxonomy mapping and first results within a single sprint.

Icon user

Your team, our support

Dedicated onboarding, domain experts who speak insurance, and continuous tuning as your questions evolve. We adapt to how your teams work, not the other way around.

Abstract symmetrical design with two light blue shapes curving inward on a black background.

Want to see Claims Discover in action?

Explore how your claims data can reveal portfolio insights. Schedule your custom demo

White abstract shape with curved and angled sections on a transparent background.Minimalist black and white abstract shape resembling a stylized leaf or feather.