



This release of Discover adds a portfolio-wide view of your claims. You can identify recurring loss patterns and the entities where losses concentrate, then measure their true weight and receive recommendations refreshed every night to support both underwriting and portfolio management.
1. Topics: understand what keeps recurring in your portfolio
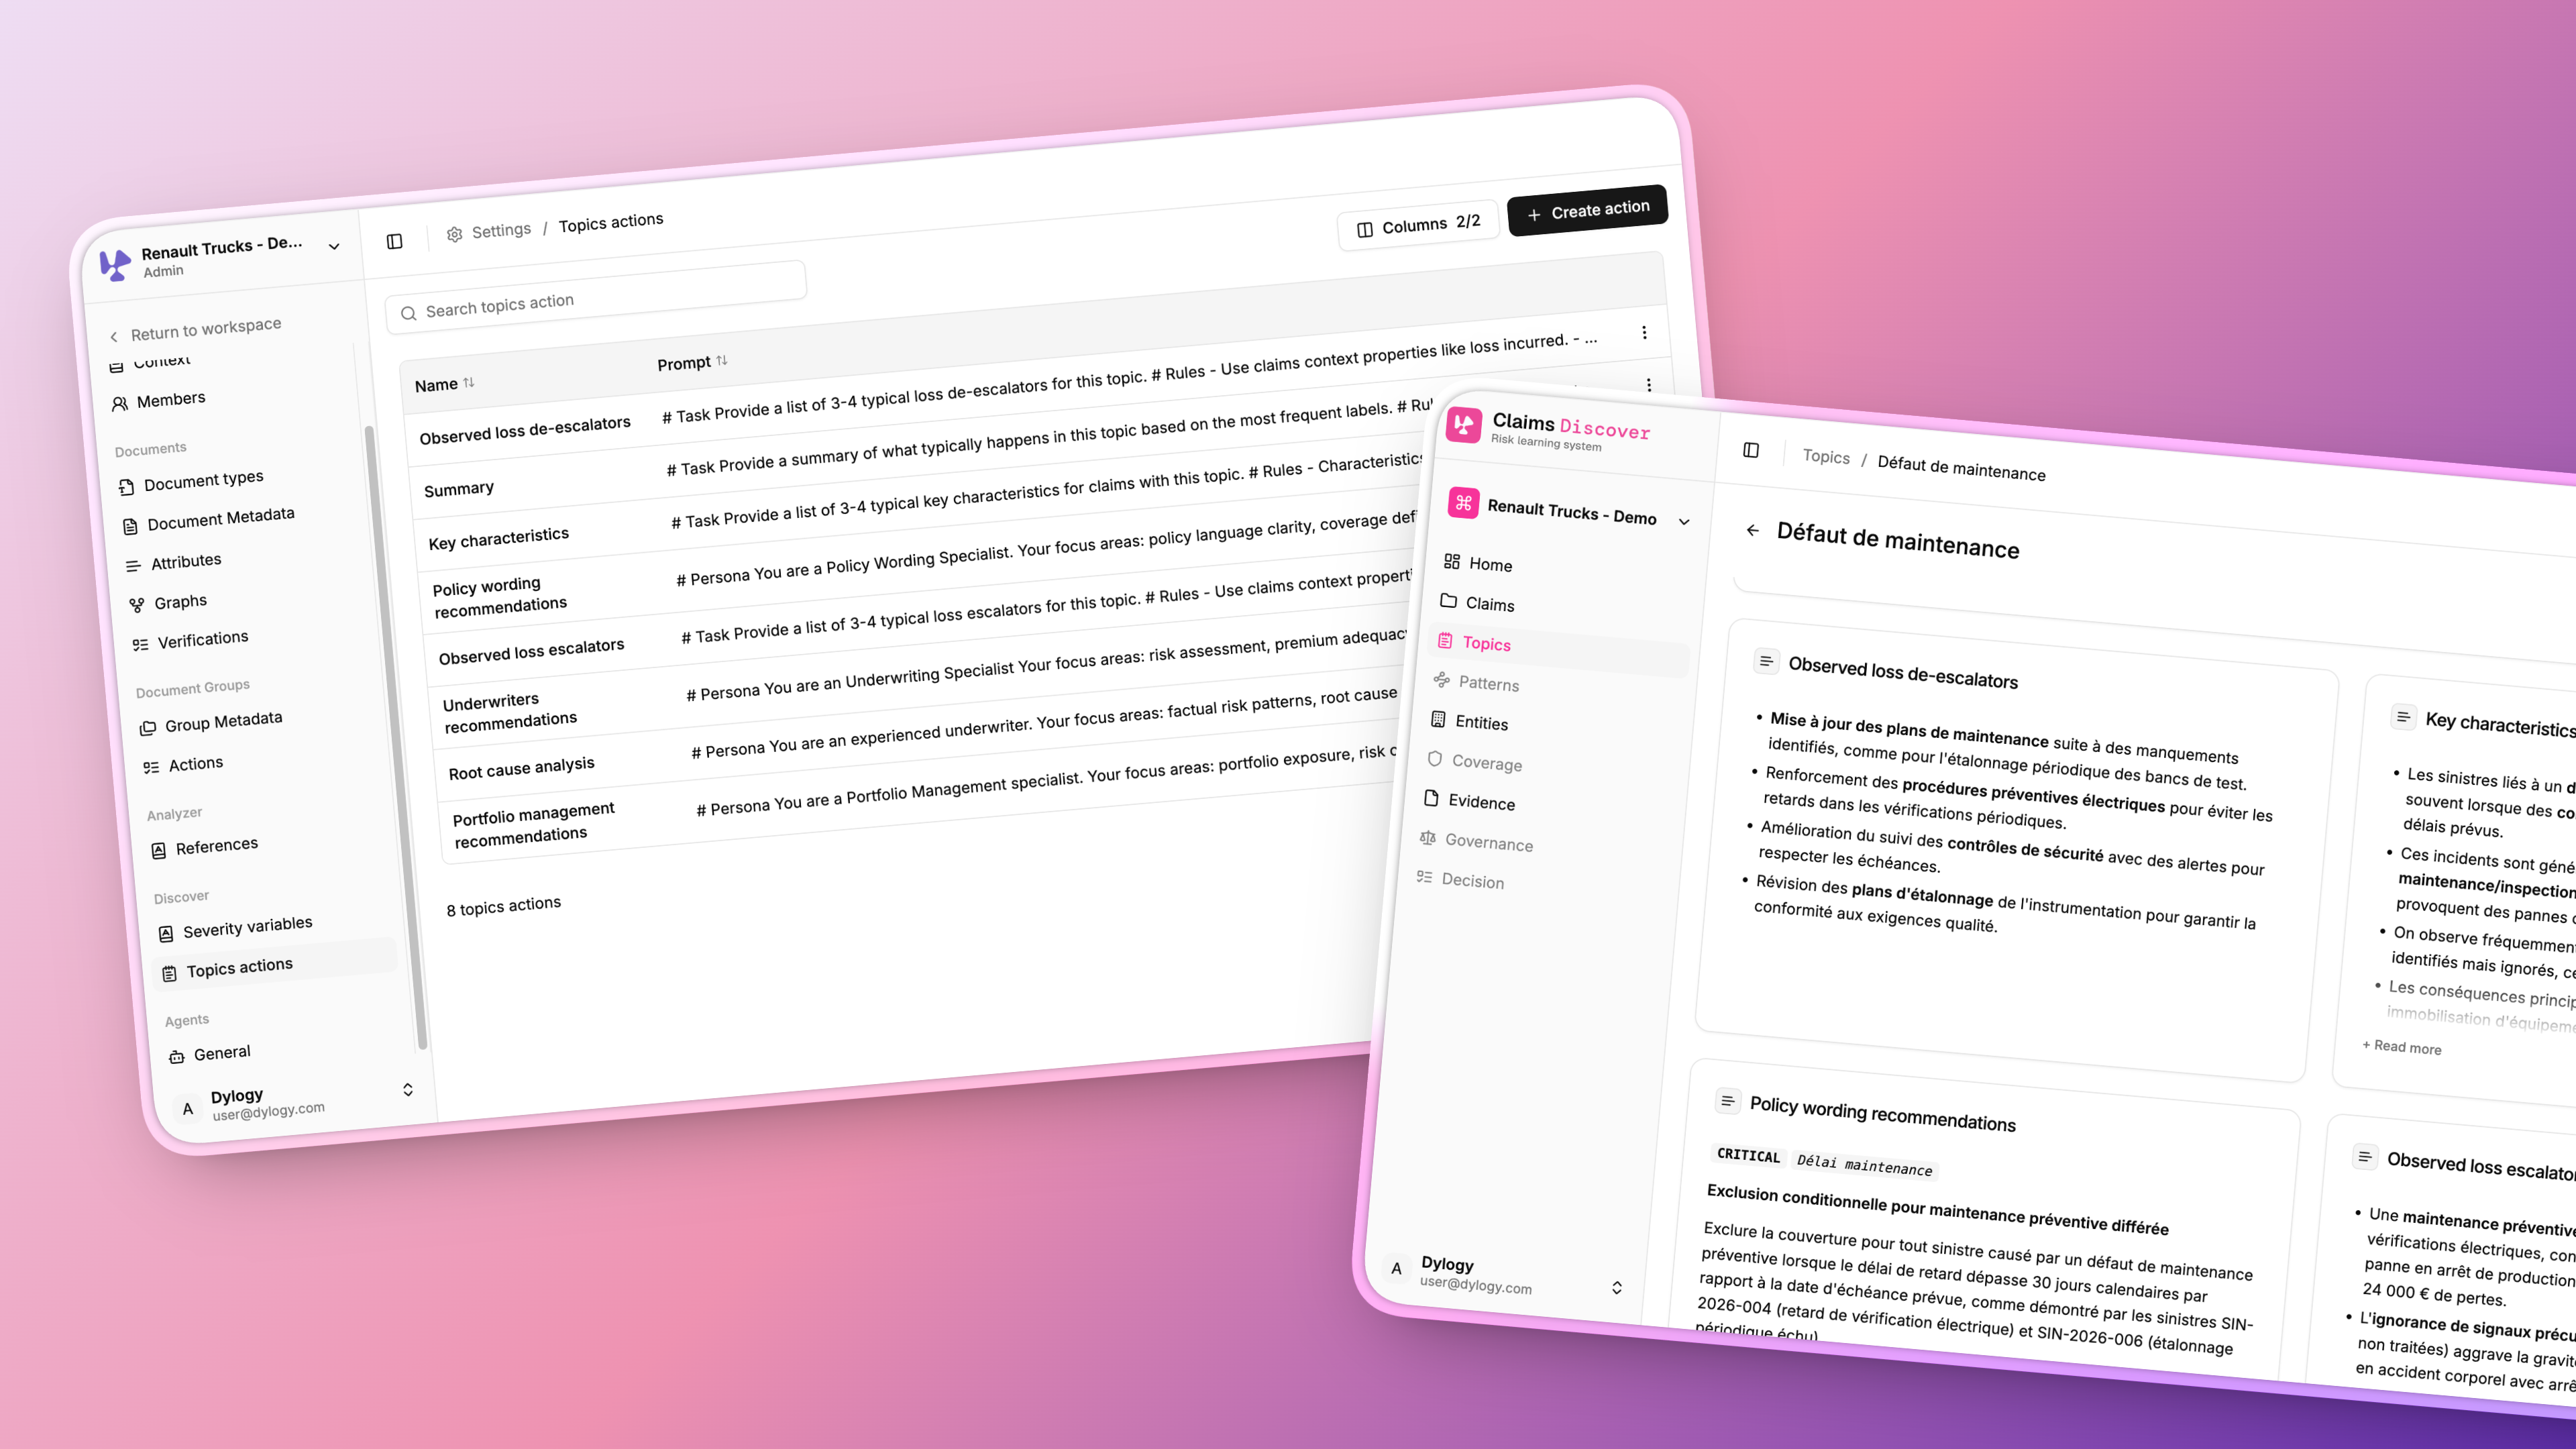
Instead of reviewing claims one by one, you now see the recurring loss patterns, along with the events that typically come before and after them. The Topics page groups claims by event type and shows how often each one occurs. Every topic has its own summary page, covering an overview, the most common event sequences, key characteristics, and the loss escalators and de-escalators observed. If a delayed inspection regularly comes before a breakdown, for example, you can step in before the loss occurs.
2. Severity variables: rank by cost as well as frequency
A rare but costly topic can now rise above a frequent one with limited impact. In the settings, you can turn any numeric metadata (claim amount, downtime, days of business interruption…) into a severity variable. Its values appear on each claim and in the claims list, roll up at topic level, and can be used to sort your analysis by the measure that matters most to you.
3. Entities: pinpoint where losses concentrate
The Entities page lists the insureds, sites, equipment, models, or regions linked to your claims, along with their share of the portfolio. For each entity, you get a summary, the observed risk factors, detailed statistics, and the related claims. This shows you which profiles drive your loss experience and where to focus underwriting or risk prevention efforts.
4. Topic actions: recommendations that keep pace with your portfolio
Administrators can set up agentic actions at topic level, tailored to each team's role: underwriting recommendations, policy wording guidance, root cause analysis, or portfolio management insights. Results are recalculated every night and displayed on the topic page, so your teams always work from up-to-date analysis without rerunning anything manually. These recommendations are designed as decision support and remain subject to review by your experts.
These features are available today. If you need help setting up your first severity variables and topic actions, contact us.
| Domaine d'Application | Bénéfices Clés grâce aux Graphes de Connaissances |
| Prévention | Identifier les causes racines communes à plusieurs sinistres pour proposer des actions préventives. Détecter les causes secondaires pour limiter la propagation des dommages. |
| Tarification | Proposer des segmentations plus fines des assurés en fonction des chaînes de causes réelles. Mieux évaluer l'impact d'une exclusion de garantie (par exemple, "Exclusion de l’usure de machines"). |
| Provisionnement | Comprendre les dynamiques d'évolution des pertes et identifier les causes qui, étonnamment, ne mènent à aucun coût, pour affiner les réserves financières. |